Interact with a Chart
Charts in the inbox have some interactivity.
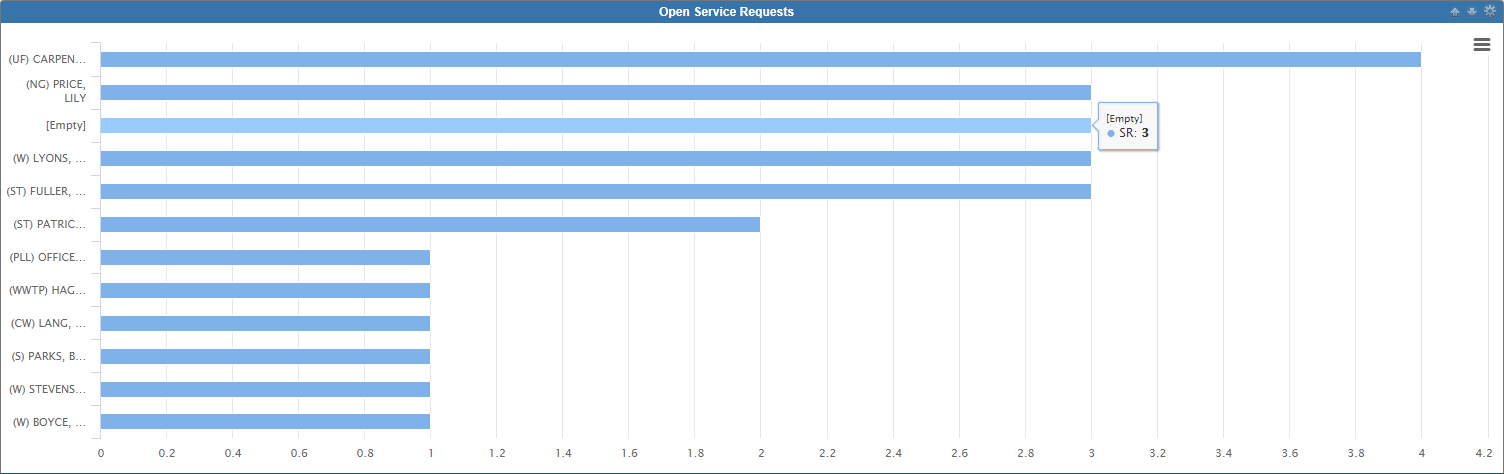
- Hover your mouse over a part of the chart, like a line on a line chart or a slice on a pie chart. A number of records or a percentage will appear. If you are using a mobile device, tap the part of the chart to see the same information.
- Click to view the records in a search results panel.